


In my final post in this series on SnapLogic Ultra Pipelines I’m going to cover the three pillars for successful implementation and data pipeline management: performance, scaling and high availability.
- Performance: Performance of an Ultra Pipeline largely depends on the response times of the end-system applications that the task is connecting to. An Ultra Pipeline containing a large number of high latency endpoint Snaps can observe a congestion of documents, building all the way up through the upstream Snaps to the feedmaster, until the feedmaster queue can no longer hold the messages. This can be avoided by either creating multiple instances of the Ultra Pipeline task or by using the Router Snap to distribute the document load. Multiple instances of an Ultra Pipeline will ensure that even if one instance is slow, others are available to consume documents and keep the feedmaster queue flowing. Likewise, a Router Snap can be used in each instance of the pipeline to distribute the documents across multiple endpoint Snaps, to improve the performance and add parallel processing capability to an instance. This is in addition to the built-in parallel computation capability of a pipeline which implies that at a given point in time, each Snap in a pipeline is processing a different document.
- Scaling: Scaling can be attained by increasing the number of instances in an Ultra Pipeline task. The total number of instances required for an Ultra Pipeline task is a direct function of the expected response time, the resource utilization of the node when a single instance of the task is running and the functional load on the Snaplex from other pipeline runs. When the execution nodes are highly utilized, adding more execution nodes allows the instances of the task to be distributed horizontally and scaled out across the Snaplex.
- High availability: In order to avoid service disruption and to allow high availability, it is highly recommended to use a load balancer with two feedmasters and two execution nodes as the minimum architecture for Ultra Pipeline setup. Such an architecture can also be used to avoid a single point of failure from a feedmaster or execution node.
Manager
Each Ultra Pipeline task is listed in the Manager/project/task menu. To view the number of documents received or processed by each instance of the task, a drop down menu listing the details of task can be used:
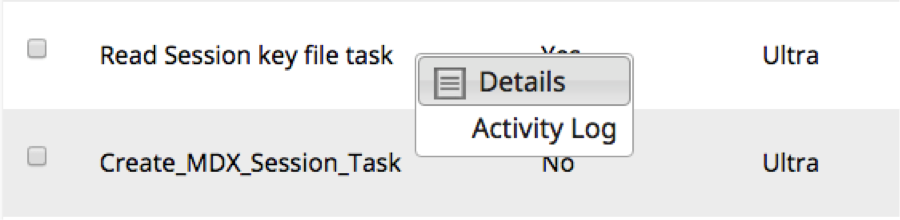
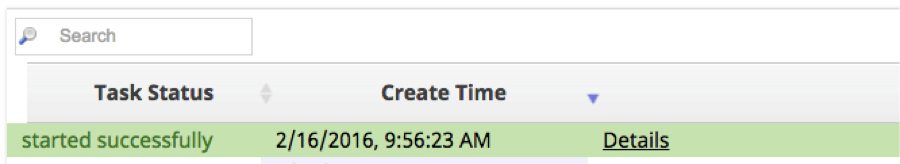
Use the Details link on a task to view the Pipeline Execution stats and monitor documents received by each Snap in the Ultra Pipeline instance.
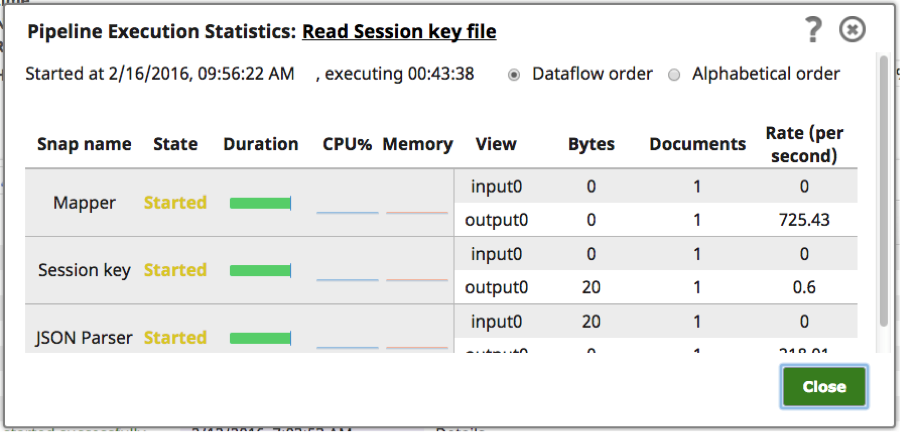
Because the detailed view lists only the documents received by that instance of the task, a more advanced monitoring might be required in case of multiple instances to get an overview of the documents, queues and subscribers. I’ve worked with SnapLogic customers on this kind of initiative using our APIs and had good results.
Next Steps:
- Check out my series of posts on SnapLogic Ultra Pipelines and be sure to let me know if you have questions or comments. Designing Ultra Pipelines, Types of Views, Error and Exception Handling)
- Check out our videos and upcoming SnapLogic Live session
- Learn more about our Professional Services Offerings