

Educational technology became invaluable at the onset of COVID-19 as 98% of universities moved their classes online. Instructors needed learning management software to monitor student performance and run their curriculums.
Two years later, many students are back on campus – while others have discovered they prefer online learning. To accommodate the demand for flexible options, universities are still increasingly leaning into ed tech. Valued at $106.46 billion in 2021, the ed-tech sector is projected to continue increasing at an annual compounding rate of 16.5% until 2030.
Ed tech is no longer just a tool for managing remote learning; it’s also a valuable source of data for education analytics. Read on to learn how to use the data from ed-tech platforms to boost student performance, identify challenges early on, and make sound budgetary decisions.
What Is Education Analytics?
Education analytics is the process of using educational data to draw insights and make predictions.
Let’s say you’re exploring course data, and you discover that students who receive a single zero-failing grade are more likely to have poor academic outcomes in the future. This insight can lead to early intervention strategies that flag disengaged students and connect them to supportive resources.
You can also use data from ed-tech platforms to:
- Track programmatic outcomes across departments
- Reduce wasteful spending
- Guide students to academic tracks where they’ll succeed
- Foster an inclusive campus environment
- Create a rewarding student experience
How to Leverage Education Analytics: Two Datasets To Evaluate
Higher ed stakeholders are already aware of the power of data. A post-pandemic survey revealed that the demand for student data had increased at 66% of the institutions surveyed.
The driving question in academia isn’t “Why leverage data?” – it’s “How can all this data be managed, understood and leveraged?”
To answer this question, let’s look at two key datasets in academia.
Enrollment Data
Enrollment data shows the number of students at a learning institution across categories like demographics, degree level and school. College application software, learning management systems (LMS), course enrollment platforms, CRMs/ERPs, and survey software can all store this type of data.
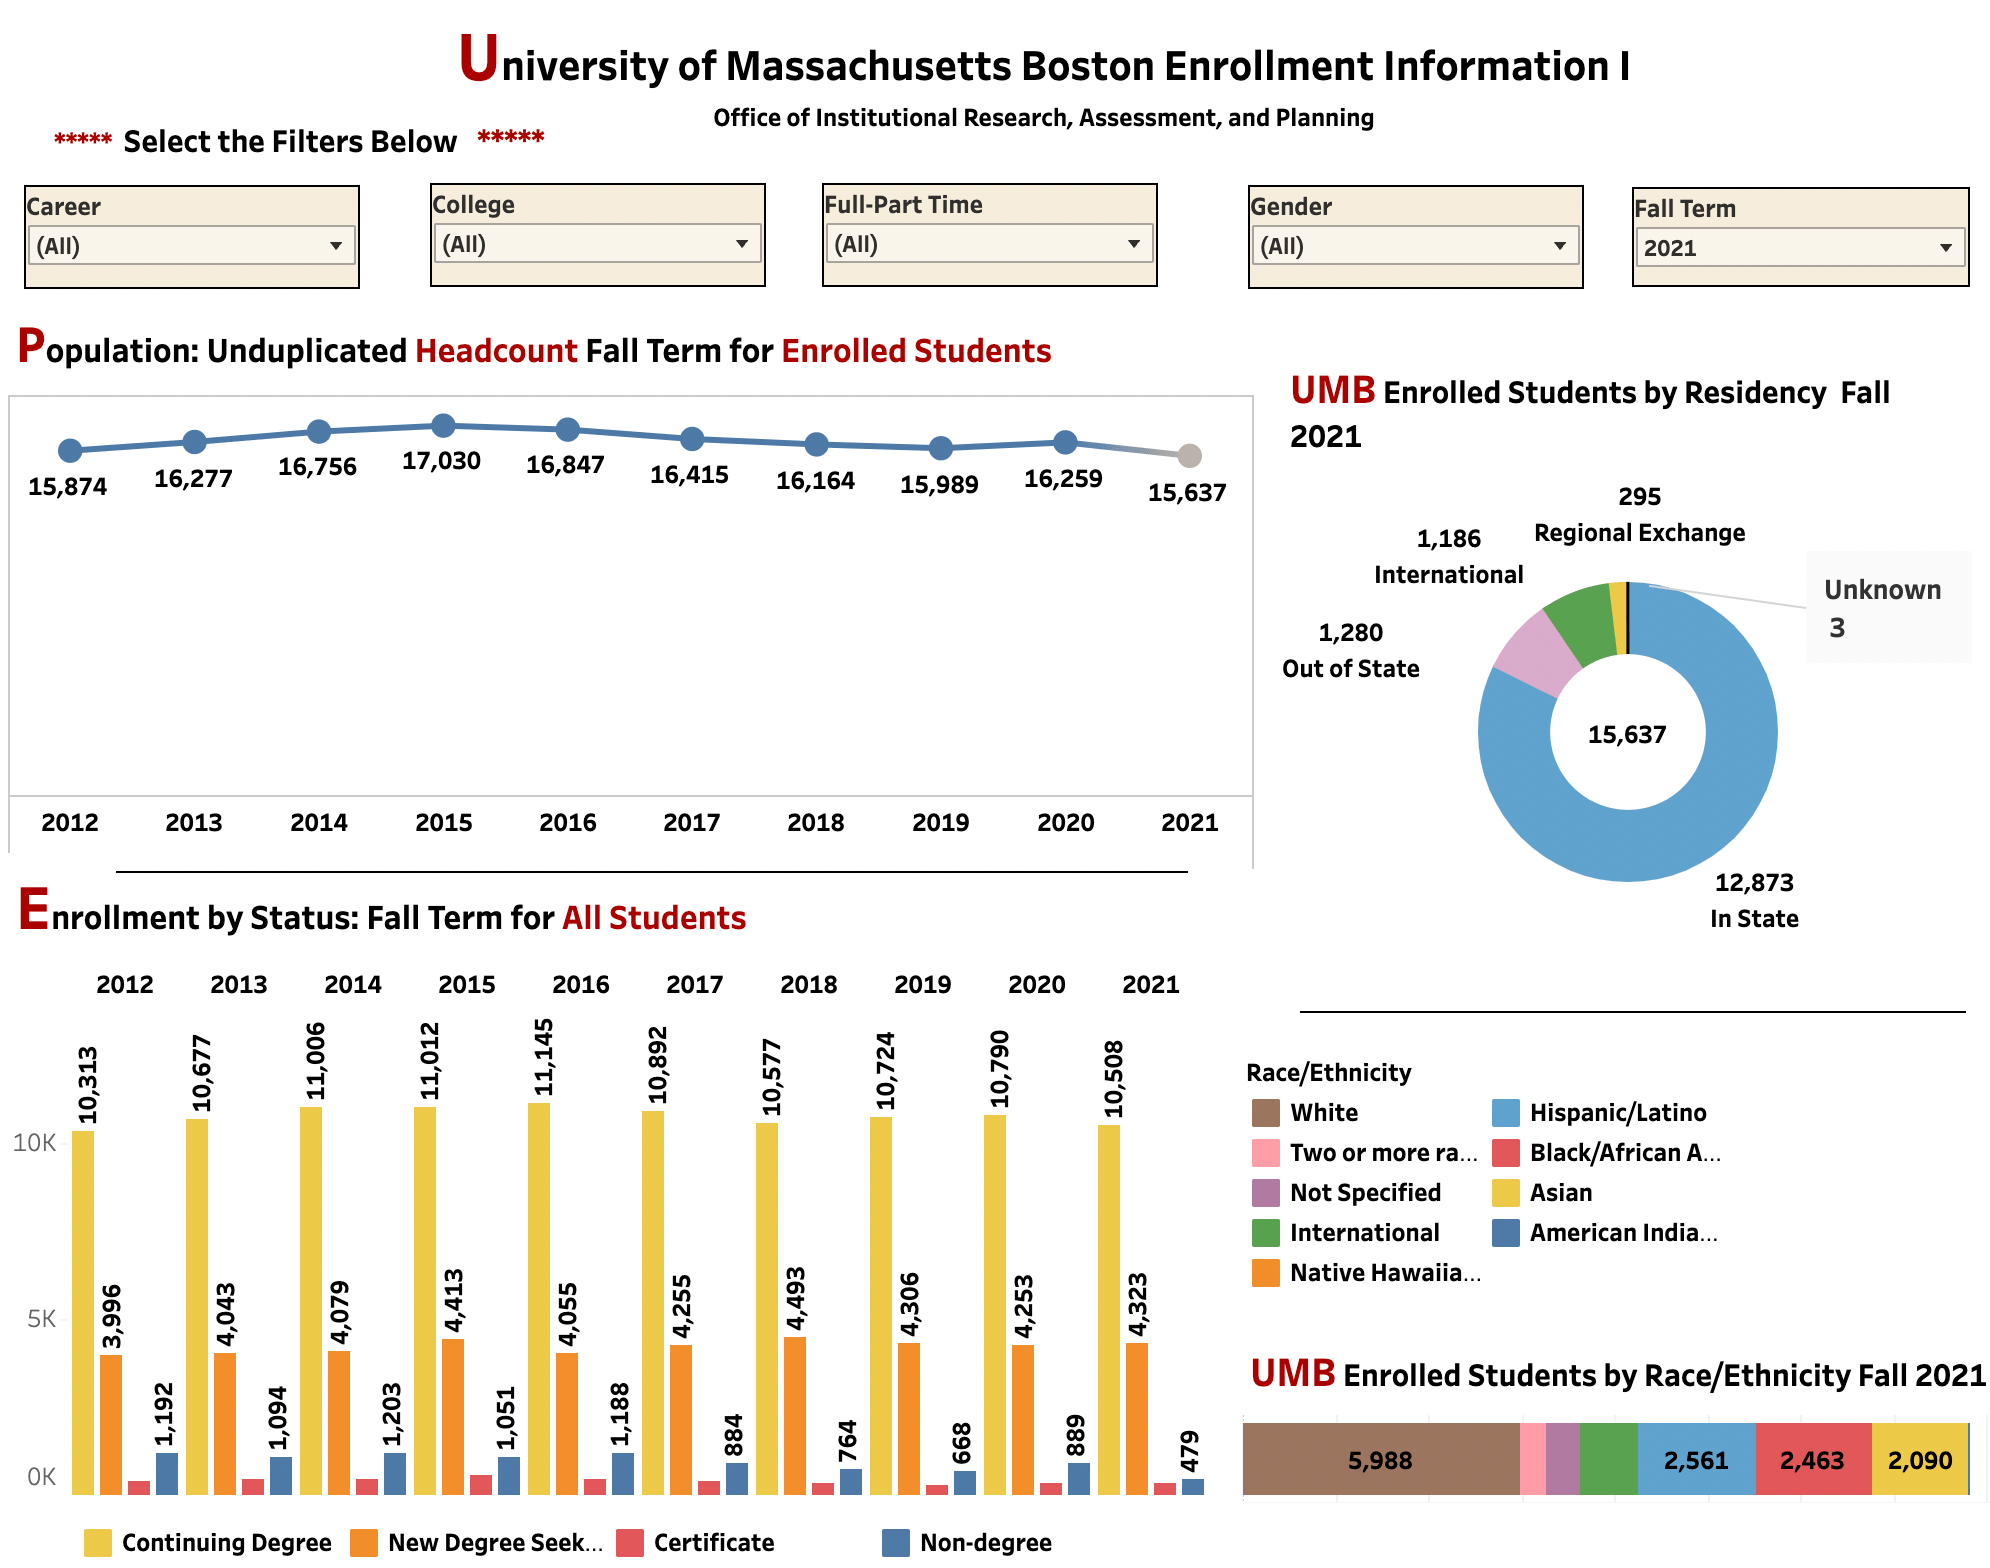
By reviewing this data over time, you can identify the categories that show an increase or decrease in students — helping you improve retention.
Say you determine that your university’s liberal arts college saw a 10% increase in enrollment over the last five years while your engineering college saw a 15% decline. That trend might lead your team to survey engineering students, so you can identify ways of improving their college experience.
Enrollment data trends also help higher education institutions strengthen their DEI (diversity, equity and inclusion) efforts. There’s good reason to pay close attention to this data, as nearly 60% of higher ed institutions miss the mark when it comes to representing marginalized groups.
Let’s say a dean discovers that the percentage of LGBTQ+ students at their university is significantly lower than at nearby colleges. They might set up a scholarship for LGBTQ+ applicants while also surveying students about LGBTQ+ culture at the school to keep the campus climate inclusive and friendly.
When enrollment data reveals a discrepancy, it’s not enough to say, “[X population] just doesn’t apply here” – that doesn’t reflect the broader applicant pool. But saying, “We’re not reaching [X population]” is a truthful and productive way to start diagnosing the issue. A university may not be connecting with a certain population because:
- The university’s recruiting efforts don’t include them in the first place: They don’t speak directly to the marginalized group or target schools and geographic areas where they’re represented.
- The recruiting efforts reach the students but fail to connect: The recruiters aren’t using language or sharing information that makes students feel like they’ll be safe and seen on campus.
- The campus atmosphere isn’t inclusive: A diverse, representative faculty and staff can help make marginalized students feel welcome and motivated. The university can apply similar methods to faculty and staff data to highlight any issues, using the data as a diagnostic tool only.
- The university doesn’t provide critical resources: Night classes, online courses, asynchronous learning, and part-time credit options make college more accessible for students who work full time or have a family. On-campus affinity groups can also help marginalized students connect with their peers and allies.
Once the university identifies their weak spot(s), they can introduce corresponding action items that can begin correcting the issue.
Course Data
Learning management systems like Brightspace, Blackboard and Canvas are key tools for managing course data. This courseware captures individual student actions and behaviors, including:
- Grades on individual assignments and tests
- Participation in class discussion forums
- Rate of assignment completion
- Clicks and module visits
- Downloads of linked resources
- Time spent reviewing each page
- Overall course engagement
Use this data to form insights and make predictions that help you boost student achievement and intervene in challenges early. Correlations in the dataset can help you make connections between student behaviors and long-term success. Keep in mind, correlations don’t necessarily imply causation – but they’re a useful way to flag connections for further exploration.
Common correlations include:
- Assignment grades vs. GPA over time: Is there a particular assignment grade that precedes further grade slippage? Is it even possible for a single assignment grade to predict overall performance?
- Course selection vs. final GPA (department level): Are there certain courses or prerequisites that make students more likely to succeed in their academic track?
- Sharp participation drop-offs vs. GPA over time: If you notice a correlation here, the participation drop-off may indicate personal challenges that require intervention.
While early intervention is critical, you can also use this data to spot more positive trends. Say students who take an optional class tend to do better in their program overall. That trend may prompt department leaders to change the optional course to a prerequisite.
As you review these two datasets, remember that course and enrollment information don’t always need to be separate. Analyze them together to understand how course programming may shape student enrollment.
Say you compare assignment grades or course engagement scores to university withdrawals. This analysis might lead you to investigate aspects of negative course experiences that lead students to leave your school.
iPaaS: The Key Ingredient in Education Analytics
Departments and offices often track their own data, walling it off from other departments and stakeholders. In a 2021 APLU study, interviewees universally identified data silos as a top barrier to university analytics.
What’s more, even those who want to share data university-wide face logistical hurdles. Who will manage the dozens of siloed tools, and how?
That’s the question Boston University’s central IT department asked as they struggled to manage over 150 integrations across their network of tools and platforms. They found their solution in an integration Platform as a Service, or iPaaS.
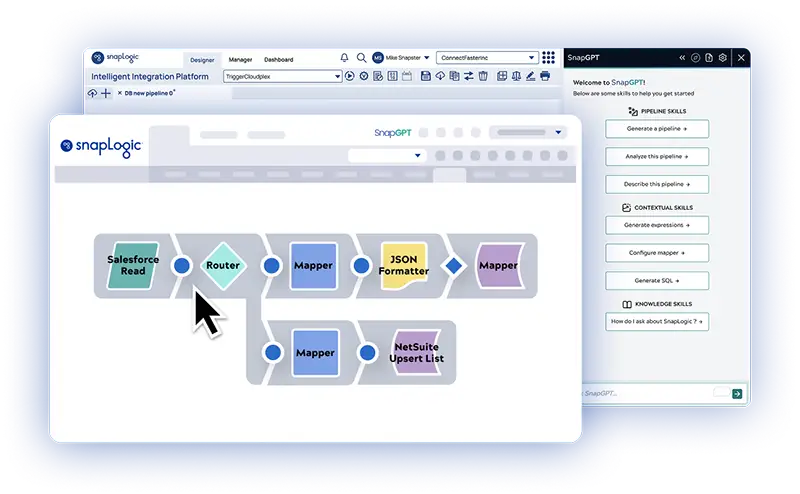
An iPaaS is a single platform that connects with many tools, platforms and applications. Once a platform or tool is integrated, the iPaaS pings it at predetermined intervals to retrieve data or move it to a centralized hub.
After researching iPaaS vendors, Boston University chose SnapLogic, a low-code/no-code platform that lets users integrate tools through pre-built connections, or “Snaps.” Snaps could be installed with a few clicks; no longer did IT have to write scripts or build out costly custom integrations.
SnapLogic’s iPaaS integrated with Boston University’s ERP system and their other 150 tools and platforms, creating a common set of data services. This gave data stakeholders at the university a “single source of truth” where everyone could benefit from the same dataset, influenced by the entire ecosystem of tools.
Before the iPaaS setup, privacy was a concern for the university. BU needed to maintain FERPA standards and wanted to think ethically about the use and visibility of student data.
SnapLogic met these expectations by providing security and access control with defined user roles and permissions. Individual student data was kept tightly locked down, but the data as an aggregate was made available to more people.
Here’s how other higher ed institutions have leveraged SnapLogic:
- Davidson College – Davidson College used SnapLogic to integrate over 200 apps and services. They also found SnapLogic critical during the COVID crisis, using the iPaaS to manage weekly COVID tests for thousands of students.
- Boston College High School – Much like Boston University, this college feeder school struggled to manage data that was siloed across many departments. They used SnapLogic to provide their staff with the critical access and transparency they needed.
Manage Your University’s Data With Confidence
An iPaaS is a critical solution that makes advanced education analytics possible, and SnapLogic is the ideal iPaaS for colleges and universities. The low-code/no-code platform empowers stakeholders from any department to integrate their tools, enabling rich insights that aren’t constrained by the IT team’s availability.
Interested in using SnapLogic at your own college or university? Talk to your university’s IT team, or book a demo and get started today.