As the integration market continues to mature, there is a constant demand to support and process more complex data and process flows. When applications process large data, they often run out of resources and become unresponsive, leaving users confused and unhappy. Gauging resources and alerting users with appropriate messages are some of the most important factors of ideal software. In the Winter 2016 release of the SnapLogic Elastic Integration Platform, we introduced the concept of pipeline queuing, which allows users to define thresholds for their Snaplexes, and when thresholds are reached, any further requests to it are queued until the next resources are available.
How do we set thresholds for Snaplexes?
SnapLogic pipelines run in a container called a Snaplex. Pipelines are made of Snaps and each Snap consumes memory in a Snaplex. Once all the memory in a Snaplex is consumed, it gets overloaded and reaches its threshold.
Since Snaps consume most of the Snaplex memory, they become an important factor in determining the Snaplex threshold. Users can define the Snaplex threshold either by defining the number of Snaps it can process at a given time or by its overall memory usage. Once the Snaplex reaches its thresholds, it does not process any pipeline requests until the resources are released and once again made available. All these rejected pipelines are marked as queued in the SnapLogic dashboard to alert users that their Snaplexes are overloaded.
Below are the values that define Snaplex thresholds. Note that the word “slots” here refers to the numbers of Snaps. I will explain each of them in detail further in this blog.
- Maximum slots
- Reserved slot %
- Maximum memory %
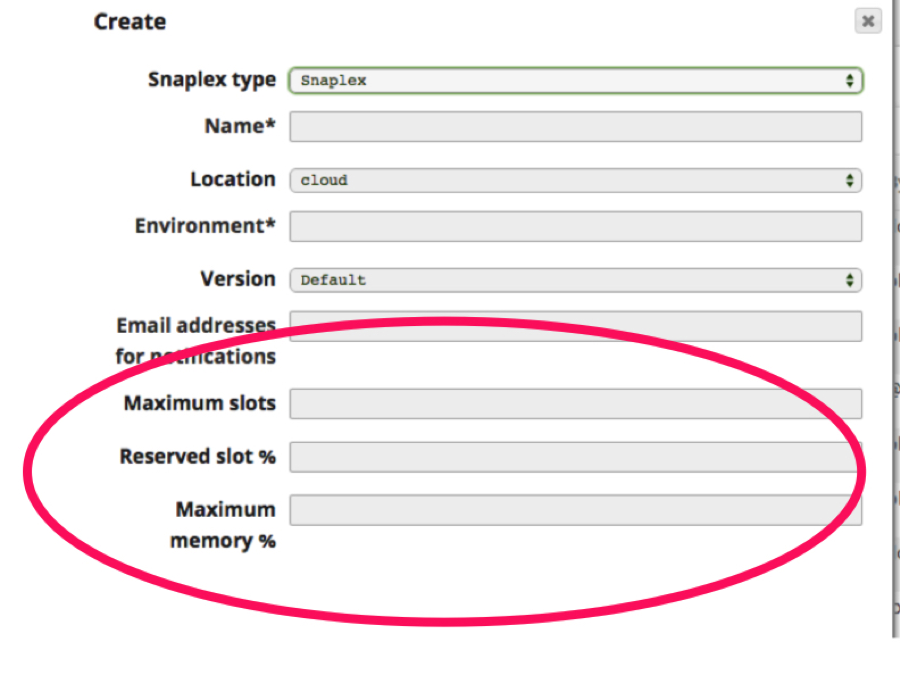
Maximum slots: The maximum number of Snaps each node in a Snaplex can process at a given time. Let me dig into the details some more with relevant examples. The two examples I’ve created are:
- Snaplex thresholds not met and accepts pipeline request
- Snaplex reaches its thresholds and subsequent pipeline requests are queued
In my examples, I have assumed that there are a certain number of pipelines already running on the Snaplex. Each Snap in the pipeline consumes a slot in the memory. Besides these, there are active threads that run basic Snaplex operations that consume Snaplex memory as well. I have accounted for both Snaps and active threads under the Consumed Snaps category.
Below is the distribution of memory:
- Maximum slots: 1000
- Consumed slots (active threads + running pipelines): 500
- Available slots (maximum slots + consumed Snaps): 500
Example 1: The Snaplex has not reached its thresholds and accepts pipeline requests.
In this example, I create a pipeline with, say, 300 Snaps and schedule it to run against this Snaplex by creating a task. When this task is scheduled to run, the Snaplex checks for its available resources, which in this case are 500. Since there are 500 slots available, the Snaplex will accept this request and process it. However, any further requests made to this will not be accepted and will get queued. I will elaborate on these details in the next example.
Example 2: The Snaplex reaches its threshold value and pipelines get queued.
In this example, I created a large pipeline with 800 Snaps and scheduled it to run. When this request goes to the Snaplex, it checks for its available slots which in this case is 500. Obviously, the request is much larger than the number of slots the Snaplex can allocate, so rejects them and pushes into a queue. Once the Snaplex has completed processing existing pipelines, it makes its resources available and processes the next request waiting in the queue. Here is a display of queued pipelines in the Dashboard:

Reserved slot %: The percentage of maximum slots allocated for manual execution of pipelines, these slots are reserved only for manual execution of pipelines. When scheduled pipelines consume all the available slots, the reserved slots ensure that the pipelines can still be executed manually.
- Maximum slots: 1000
- Reserved slot %: 10 = 100
- Consumed slots: 900
- Available slots (maximum slots = reserved slot % + consumed slots): 0
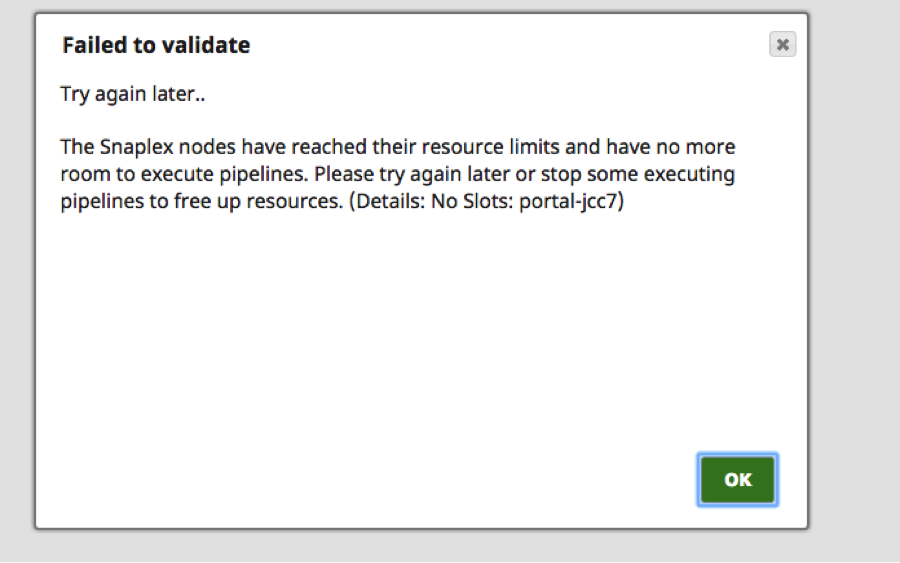
Let’s consider the same example from above and assume that all the available slots are consumed. Any further scheduled pipelines will get queued since the slots are all taken. However, since reserved slots are allocated a value, I can still run pipelines from the SnapLogic Designer that contains no more than 100 Snaps. However, if I run pipelines with more than 100 Snaps, they will be rejected and queued and an error message (shown below) will be displayed to the user:
Memory percentage: Another important factor to measure the Snaplex threshold is the Snaplex memory. When I set the memory percentage to, say, 75%, pipeline requests are accepted until 75% of Snaplex memory is consumed. Once this threshold is reached, all other requests are queued and processed later once the memory becomes available.
Summary
To summarize, Snaplex thresholds are user-defined and when a Snaplex reaches its threshold, pipeline requests get rejected and are marked as queued in the Dashboard. In order to avoid Snaplex overloading, users can tune their scheduled tasks or add more nodes to their Snaplexes.

